Every food service operator eventually faces the same arithmetic problem: translate a menu, a seating count, and a service schedule into a single kilogram-per-day figure that determines which ice maker to buy — or whether the machine you already own is still the right size as your business grows. Guess too low and your bar runs dry during Friday dinner service. Guess too high and you are paying for production capacity that sits idle overnight while consuming water and electricity.
This guide gives you a repeatable method to calculate your actual ice demand rather than relying on rule-of-thumb estimates like "1 kg per seat." The approach works backward from what actually consumes ice — individual drinks and non-beverage uses — then applies peak-hour scaling and seasonal adjustment so your final number accounts for when ice leaves the bin fastest, not just how much leaves it over 24 hours.
1. The Per-Drink Ice Weight Benchmark
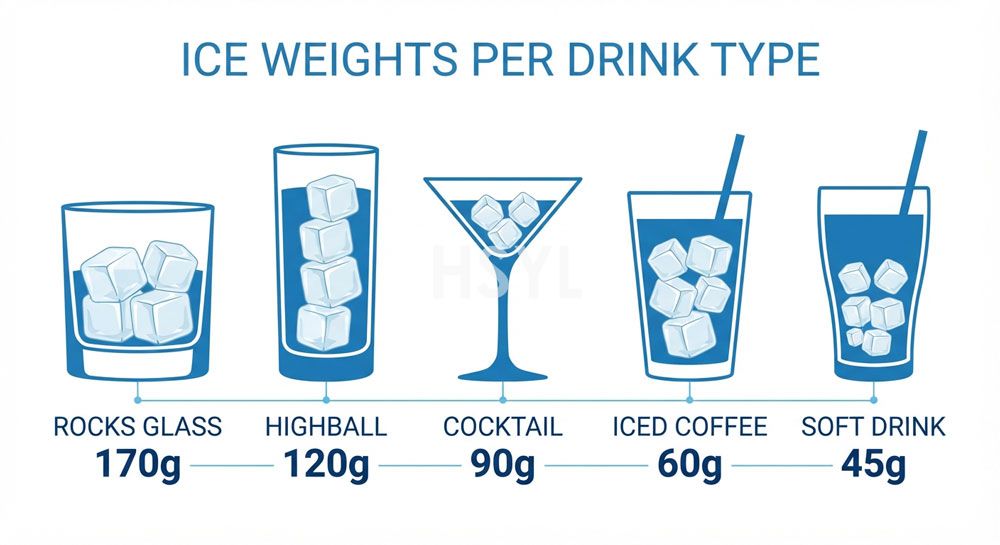
The starting point for any accurate ice calculation is knowing how many grams of ice go into each drink type you serve. The table below lists typical ice quantities for standard portions. These figures are based on industry averages for full-cube or crescent ice; adjust upward by 10–15% if you use flake ice (lower density per scoop volume) or if your bartenders use heavier pours than standard.
| Drink Category | Typical Serving Vessel | Ice per Drink | Notes |
|---|---|---|---|
| Cocktails (stirred/neat presentation) | Rocks glass / Old Fashioned | 140–180 g | Large single cube or 2–3 standard cubes; varies by style (Martini uses less, Old Fashioned uses more) |
| Cocktails (shaken) | Coupe / Nick & Nora | 80–120 g | Dilution ice plus serving ice; shaken drinks lose ~25% mass to dilution during shake |
| Highballs and tall drinks | Highball glass (10–12 oz) | 100–140 g | Gin tonic, whiskey soda, Tom Collins; ice fills roughly half the glass volume |
| Iced coffee and cold brew | Pint glass / plastic cup (16 oz) | 50–80 g | Iced latte, cold brew, Vietnamese iced coffee; ice-to-liquid ratio typically 1:3 to 1:4 |
| Blended and frozen drinks | Blender cup (16–20 oz) | 180–250 g | Frozen margarita, smoothie, frappe; blended drinks consume significantly more ice than straight-served beverages |
| Soft drinks and fountain service | 12 oz cup (with refills) | 35–60 g per pour | Cola, lemonade, iced tea; factor refill rate (average 1.3–1.5 refills per customer in casual dining) |
| Beer (chilled, not iced) | Pint glass | 0 g (glass-chilled only) | Most beer is served from refrigerated taps or coolers; ice is rarely added except for shandy-style drinks |
| Wine (chilled, not iced) | Wine glass | 0 g | No ice consumption unless wine spritzer or sangria program exists |
Calculation Note: The single largest source of sizing error is using an average ice-per-drink figure across your entire menu instead of breaking down consumption by drink category. A 60-seat wine bar where 70% of sales are wine-by-the-glass needs one-tenth the ice of a 40-seat cocktail lounge where every order is a stirred or shaken drink using 150 g+ of ice per serving.
2. Build Your Menu Ice Profile
Once you know the per-drink ice weight, build a profile of your actual menu mix. You do not need point-of-sale data to produce a useful estimate — a reasonable approximation based on your menu categories and expected order distribution is sufficient for initial sizing. Refine with actual sales data once your venue has operated through at least one full season.
| Menu Category | Avg Orders/Day — Enter Your Count | Ice per Order | Daily Ice Calc |
|---|---|---|---|
| Stirred cocktails (Old Fashioned, Negroni, Manhattan) | ______ (e.g., 15–45 for cocktail bar; 3–8 for casual restaurant) | 160 g | = your count x 0.16 kg |
| Shaken cocktails (Daiquiri, Margarita, Sour family) | ______ (e.g., 20–55 for cocktail bar; 5–12 for casual restaurant) | 100 g | = your count x 0.10 kg |
| Highball and tall drinks | ______ (e.g., 10–30 for bar; 15–40 for pub/lounge) | 120 g | = your count x 0.12 kg |
| Iced coffee / cold brew | ______ (e.g., 40–100 for cafe; 8–20 for restaurant with coffee program) | 65 g | = your count x 0.065 kg |
| Blended / frozen drinks | ______ (e.g., 10–25 for beach bar/smoothie cafe; 2–5 for standard restaurant) | 215 g | = your count x 0.215 kg |
| Soft drinks / fountain (including refills) | ______ (e.g., 30–80 for family restaurant; 10–25 for upscale dining) | 50 g | = your count x 0.05 kg |
| Beer (no ice) | ______ (enter for reference only; ice = 0) | 0 g | = 0 (exclude from subtotal) |
| Wine (no ice, unless spritzer) | ______ (enter for reference only; ice = 0) | 0 g | = 0 (exclude from subtotal) |
| SUBTOTAL — Your Beverage Ice Demand | = Sum of rows 1-6 only | ||
Non-Beverage Ice Uses
Beverage ice is usually the dominant consumer, but most venues have additional ice draws that can add 10–30% to the total depending on operation type:
| Non-Beverage Use | Typical Daily Quantity | Venues Where This Applies |
|---|---|---|
| Buffet salad bar / garnish display cooling | 5–20 kg / day | Hotel breakfast buffets, cafeteria self-service lines, catering display stations |
| Seafood display bed (fish, shellfish, sushi) | 10–40 kg / day | Seafood restaurants, supermarket fresh counters, oyster bars |
| Food prep cooling (blanching stop, ingredient chill) | 3–15 kg / day | Kitchens doing batch pasta blanching, sauce cooling, stock rapid-chill |
| Room service minibar replenishment | 0.5–2 kg per room serviced | Hotels with daily minibar ice restock program |
| Banquet event setup (multiple stations) | 20–100 kg per event | Hotels and convention centers hosting wedding/banquet events |
| Patient hydration and meal service | 5–15 kg per 100 patients/day | Hospital cafeterias and ward pantries |
| Add non-beverage subtotal | + [Your sum, e.g., 5-20 for buffet, 10-40 for seafood, 3-15 for food prep] | |
Working Total Formula: Daily Ice Demand = (Sum of all beverage category totals) + (Sum of applicable non-beverage uses). This is your baseline daily figure before applying peak-hour and seasonal multipliers.
3. Apply Peak-Hour Scaling
Your ice maker does not produce ice at a constant rate throughout the day — it produces continuously while the storage bin buffers the gap between production and consumption. The critical question is whether your machine's sustained production rate exceeds your peak-hour draw-down rate. If peak-hour consumption outpaces production, the bin depletes during the rush even if 24-hour production would theoretically cover total demand.
| Venue Type | Peak Period | Peak-Hour % of Daily Total | Implication |
|---|---|---|---|
| Café (morning-heavy traffic) | 7:00 – 10:00 AM | 25–35% | Machine must sustain 3–4× average hourly output during morning window |
| Lunch-service restaurant | 12:00 – 2:00 PM | 30–40% | Two-hour compressed lunch rush concentrates 1/3 of daily demand into a short burst |
| Dinner-service restaurant | 7:00 – 9:30 PM | 35–45% | Highest peak concentration; dinner service often drives the sizing decision even if lunch operates too |
| Cocktail bar (evening-only) | 9:00 PM – 12:00 AM | 40–55% | Late-night bars have the steepest peak-to-average ratio; storage buffer is critical |
| 24-hour operation (hotel/diner) | Multiple smaller peaks | 15–20% per peak | Lower peak concentration but no overnight catch-up recovery window; size for highest single-peak hour |
| Hotel banquet (event-driven) | Event setup window (2–3 hr) | 50–70% of event total | Bursty demand pattern favors large storage bin over high production rate |
Sizing Rule: Minimum required 24-hour capacity = (Baseline daily demand) × (Peak-hour safety factor). Use 1.5× for venues with moderate peak concentration (cafes, lunch restaurants), 1.8×–2.0× for high-concentration venues (dinner-only restaurants, cocktail bars, banquet operations). The safety factor covers both the peak surge and the reduced production efficiency that occurs when inlet water temperature rises during busy service periods.
4. Adjust for Seasonal Variation
Ice demand is not static year-round. Outdoor temperature, menu seasonality, and guest behavior shift consumption by 50–100% between low season and high season in most climates. Size for your worst-case month, not your annual average.
| Climate Zone / Season | Seasonal Multiplier | Typical Driver |
|---|---|---|
| Winter (temperate climate, indoor service only) | 0.7× – 0.85× baseline | Hot drink orders rise; iced beverage orders fall; outdoor seating unused |
| Spring / Autumn (moderate temps) | 1.0× baseline | Mixed hot/cold orders; use this as your reference baseline |
| Summer (hot climate, outdoor seating active) | 1.5× – 2.0× baseline | Iced drink share jumps to 60%+ of orders; outdoor patio service adds volume; blended/frozen drink orders surge |
| Tropical / year-round hot climate | 1.5× – 1.8× year-round | No off-season relief; size for continuous high-demand operation |
| Holiday / special event periods | 1.3× – 1.7× for event duration | Christmas, New Year, local festivals, sporting events near venue |
Practical Approach: If you operate in a four-season climate, calculate your baseline from spring/autumn sales data, apply the summer multiplier (typically 1.6×–1.8× for venues with outdoor seating or strong iced-coffee programs), and use that adjusted figure as your target 24-hour capacity. Running slightly oversized during winter months is far less costly than running short during the three hottest months of the year when ice demand peaks and compressor efficiency drops due to higher ambient air temperatures.
5. Match Calculated Demand to Equipment Tier
Once you have your final sized demand figure (baseline × peak factor × seasonal factor), match it against HSYL equipment tiers. The table below maps demand ranges to model families with specific recommendations.
| Your Calculated 24-Hour Demand | Recommended Tier | Model Options | Key Spec |
|---|---|---|---|
| Under 50 kg / 24 h | Under-counter upright (Tier 1) | SD-65 (15 kg), SD-80 (45 kg) | 430 mm width, 220V, fits under 70 cm counter |
| 50 – 100 kg / 24 h | Under-counter upright (Tier 1) | SD-100 (50 kg), SD-120 (60 kg), SD-150 (70 kg) | 530 mm width, 220V, fits under 80 cm counter |
| 100 – 300 kg / 24 h | Entry floor-standing (evaluate options) | Multiple SD-150 units in parallel OR step up to larger platform | Compare TCO: 2–3× upright vs 1× mid-capacity floor unit |
| 300 – 1,500 kg / 24 h | Commercial floor-standing (Tier 2) | SD-3000 (1,360 kg) or SD-4000 (1,800 kg) | 380V three-phase, water-cooled, 1220×960 mm footprint |
| Over 1,500 kg / 24 h | Multi-unit deployment | SD-4000 + supplementary units, or distributed layout | Central plant + satellite under-counter stations |
The Under-Counter vs Floor-Standing Decision Point
If your calculated demand falls in the 100–300 kg / 24 h range — the gap between the largest under-counter model (SD-150 at 70 kg) and the smallest floor-standing model (SD-3000 at 1,360 kg) — you face a common sizing dilemma. Three approaches resolve this:
- Parallel under-counter configuration. Two or three SD Square Series upright units installed side by side or at separate stations. Advantages: lower upfront cost, 220V compatibility, redundancy (if one unit fails, others continue producing). Disadvantages: multiple service points, higher aggregate electricity per kilogram produced, more floor space consumed than a single floor-standing unit.
- Step up to SD-3000 despite apparent oversizing. Accept that the machine will run below rated capacity during normal operation but will have headroom for growth, seasonal peaks, and special events. Advantages: single service point, lower per-kg operating cost, industrial-grade durability, 380V stability. Disadvantage: higher upfront purchase price and electrical installation cost than the parallel-under-counter option.
- Hybrid layout. One SD-150 (70 kg) for the primary bar station handling steady-state demand, supplemented by a second SD-150 at a backup or satellite station for peak overflow and event coverage. This gives you 140 kg combined capacity with redundancy and distributed placement, at a total installed cost typically below a single SD-3000 including electrical upgrade.
6. Worked Example: 80-Seat Cocktail Lounge
To make the calculation concrete, here is a complete worked example for a hypothetical 80-seat cocktail lounge open Thursday through Saturday evenings, with a small kitchen serving appetizers.
Step A — Menu Profile
| Menu Category | Orders per Busy Evening (Thu-Sat avg) | Ice per Order | Evening Ice (kg) |
|---|---|---|---|
| Stirred cocktails (Old Fashioned, Negroni, Sazerac) | 45 | 160 g | 7.2 |
| Shaken classics (Cosmopolitan, Whiskey Sour, Daiquiri) | 55 | 100 g | 5.5 |
| Highball-style (Gin Tonic, Paloma, Dark & Stormy) | 30 | 120 g | 3.6 |
| Beer and wine (no ice, excluded) | 80 | 0 g | 0 |
| Soft drinks / mixers (non-alcoholic) | 20 | 50 g | 1.0 |
| Appetizer plate garnish (oyster, ceviche display) | — | — | 3.0 (estimated) |
| EVENING TOTAL | 20.3 kg | ||
Step B — Scale to Full Week and Apply Factors
| Calculation Step | Figure | Notes |
|---|---|---|
| Evening average (3 nights/week) | 20.3 kg/night | From Step A above |
| Weekly total (Thu-Sat only) | 60.9 kg/week | 20.3 × 3 operating nights |
| Peak night (Saturday) | 28 kg estimated | Saturday typically 35–40% above weeknight average |
| Peak hour (9:30–11:00 PM on Saturday) | ~11 kg/hr | ~40% of Saturday evening concentrated in 1.5-hr peak window |
| Summer multiplier (outdoor patio active Jun-Aug) | 1.6× | Outdoor seating adds iced drink volume; blended drinks join menu |
| Summer Saturday peak demand | ~45 kg / 24 h | 28 kg × 1.6 seasonal factor |
| Peak-hour safety factor (1.8× for high-concentration bar) | — | Apply to final equipment selection |
Step C — Equipment Recommendation
Recommendation for this 80-seat cocktail lounge: An SD-150 (70 kg/24 h, 530 mm width) installed under the main bar counter provides adequate capacity for summer Saturday peak demand (~45 kg) with a 1.55× safety margin. For venues wanting redundancy or planning growth beyond 80 seats within two years, consider dual SD-120 units (60 kg × 2 = 120 kg combined) at separate bar positions, giving both capacity headroom and operational redundancy if one unit requires service. If the lounge expands to a 7-day operation or adds lunch service in the future, the demand profile shifts into the 80–120 kg/day range, at which point evaluating an SD-3000 floor-standing unit becomes worthwhile for its lower per-kg operating cost and single-point service convenience.
7. Common Calculation Mistakes
- Using "1 kg per seat per day" as a universal rule. This heuristic originated from full-service restaurant averages in the 1990s and assumes a balanced food-and-beverage menu with moderate cocktail presence. It wildly overestimates for wine bars (actual demand may be 0.1–0.2 kg/seat/day) and underestimates for blended-drink-focused beach bars or smoothie cafes (demand may exceed 3 kg/seat/day in summer).
- Ignoring the refill factor for fountain soft drinks. A 12-oz soft drink poured with 45 g of ice seems minor until you account for 1.4 average refills per customer in casual dining. That turns 50 soft drink orders per day into 120 actual pours and triples the soft-drink ice line item from 2.25 kg to 6.75 kg.
- Calculating from annual average instead of peak-month demand. If your January demand is 40 kg/day and your July demand is 75 kg/day (due to iced drinks and outdoor seating), sizing for the 57 kg annual average means you run short every summer weekend. Always size for your highest-demand month, not your annual mean.
- Forgetting banquet and event surges. A hotel restaurant that normally produces 200 kg/day may need 500+ kg on a Saturday when a wedding reception draws 200 guests across three simultaneous bars. Either size the base machine for event-level demand (expensive) or plan a supplemental ice procurement strategy (bagged ice backup, mobile rental unit) for event days.
- Not accounting for ice lost to dilution in shaken drinks. Shaken cocktails consume 80–120 g of ice per drink in the tin, but roughly 25–30% of that mass melts into the drink during shaking and is never recovered. This "invisible" ice consumption must be included in your calculation because the ice maker had to produce it even though it ends up as liquid in the glass.
Planning Resources for Your Ice Supply Setup
Your ice demand calculation feeds directly into equipment selection. These HSYL resources are the next step once you know your target kilogram-per-day figure:
- SD Square Ice Series Upright Ice Makers — Five models from 15 to 70 kg/24 h in 430 mm and 530 mm widths for under-counter installation in bars, cafes and small venues whose calculated demand falls below 100 kg/day.
- SD-3000 / SD-4000 Commercial Cube Ice Maker — Industrial-grade floor-standing units at 1,360 and 1,800 kg/24 h for restaurants, hotels, hospitals and supermarkets whose calculated demand exceeds 300 kg/day.
- Kitchen Equipment Solutions — Broader planning context for integrating ice supply into your complete kitchen equipment layout alongside cooking, refrigeration and preparation stations.
- Cooking Range 700 Series — If your ice demand calculation is part of a larger new-kitchen equipment package, cooking range selection affects utility budget allocation and floor plan space available for the ice maker location.
- How to Choose Commercial Kitchen Equipment for a Central Kitchen — Capacity planning methodology applicable to ice supply sizing, covering the same structured approach of matching throughput to equipment tier across all kitchen categories.
Frequently Asked Questions
How much ice does a 50-seat restaurant need per day?
What is the average amount of ice per cocktail?
How do I calculate peak hour ice demand?
Does outdoor seating affect ice demand significantly?
Should I size my ice maker for average daily demand or peak demand?
How much ice does a hotel need per day?
What is the difference between daily ice capacity and ice storage capacity?
Can I use one ice maker for multiple bars or stations in my venue?
Related Articles


Get professional consultation
Do you have any questions or need technical support regarding the content of this article? Fill out the form below, and our expert team will provide you with professional solutions.