When a canned fish or canned vegetable line underperforms its nameplate output, the instinct of most production managers is to chase the most visible failure. Leaky seams trigger seamer retooling. Underfill alarms trigger filler nozzle calibration. Product discoloration triggers retort temperature checks. Each of these responses is correct for the specific defect it addresses, but none of them answers the question that actually controls line throughput: which station is the pacemaker?Whenever seamer indexing causes line backpressure, follow our diagnostic protocol in 5 common double seam defects and seamer adjustments.Whenever seamer indexing causes line backpressure, follow our diagnostic protocol in 5 common double seam defects and seamer adjustments.
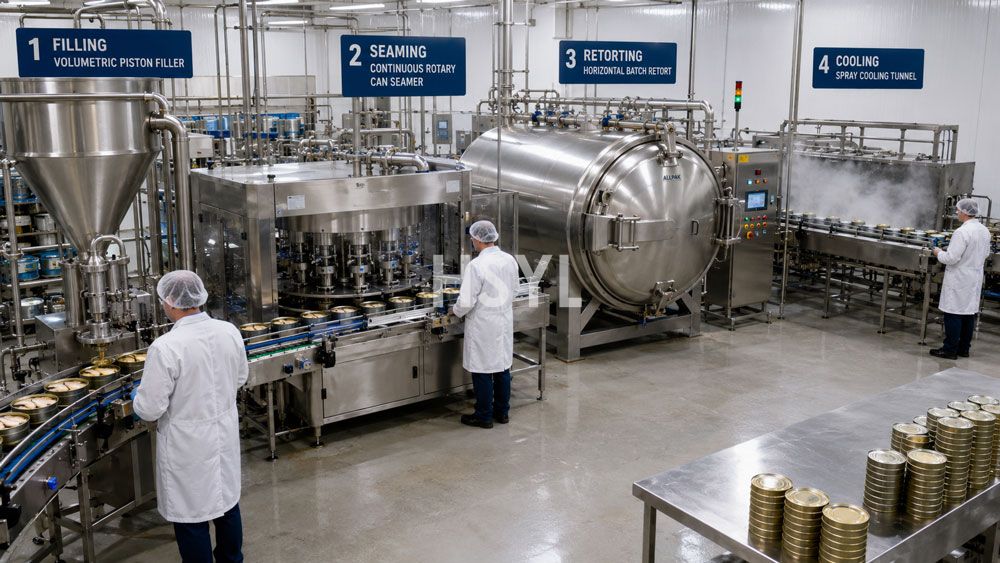
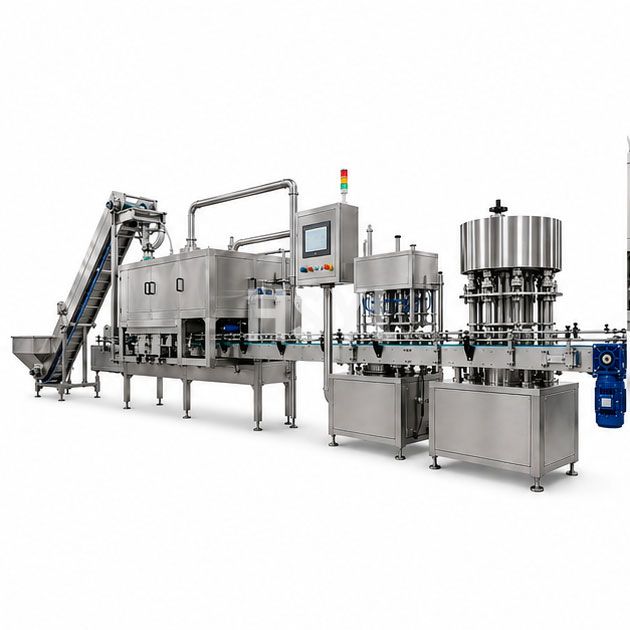
A bottleneck is not the same as a defect source. Filling and seaming stations generate quality problems that operators see immediately; retort and cooling stations govern line capacity that managers measure only at end-of-shift reports. The station with the longest cycle time, not the noisiest alarm, determines how many cans your line can produce in a day. For most small and medium canned food operations running batch retorts, that station is the retort or the cooling tunnel, not the filler or the seamer. For a broader view of how individual machines fit into an integrated seafood processing workflow, see HSYL's seafood processing solutions overview.
This guide walks through a structured diagnostic framework for identifying the real constraint on a canning line covering filling, seaming, retort, and cooling stations. The framework applies to tuna, sardine, mackerel, meat, vegetable, and pet food canning operations producing between 5,000 and 60,000 cans per day on batch retort equipment. The methodology does not require software, specialized sensors, or capital investment — it requires a stopwatch, a clipboard, and the discipline to measure before adjusting.
1. Distinguish Bottleneck From Defect Before Touching Any Station
Conflating defects with bottlenecks is the single most common diagnostic error on canning lines. The two problems require opposite responses. A defect source needs quality intervention — tooling adjustment, parameter change, cleaning cycle, or operator retraining. A bottleneck needs capacity intervention — cycle time reduction, buffer addition, parallel equipment, or process scheduling change. Applying the wrong response wastes money and rarely solves the underlying problem.
The diagnostic distinction rests on three measurable quantities:
| Concept | Definition | How to Measure | What It Tells You |
|---|---|---|---|
| Takt time | Available production time divided by customer demand quantity | Shift minutes minus breaks and cleaning, divided by target cans per shift | The pace the line must sustain to meet demand. If any station cycle time exceeds takt time, that station cannot keep up. |
| Cycle time | Time required for a station to process one unit (or one batch for retort) | Stopwatch measurement of 20 consecutive cycles, take median value | The actual pace the station achieves. Compare to takt time to identify stations operating above capacity limit. |
| Utilization | Actual cycle time divided by takt time, expressed as percentage | Cycle time / takt time × 100 | Stations above 85% utilization are constraint candidates. Stations above 100% cannot meet demand and are confirmed bottlenecks. |
Diagnostic Discipline: Build a process capacity chart listing every station's effective units per hour before adjusting any equipment. The station with the lowest effective capacity is the pacemaker. Upstream stations running faster than the pacemaker accumulate queues; downstream stations running faster than the pacemaker sit idle waiting for input. Both symptoms confirm the pacemaker location.
2. Filling Station: High Visibility, Low Constraint Risk
Filling stations trigger alarms more frequently than any other canning line station because underfills and overfills fail inline check-weigher verification instantly. This high alarm rate creates a false impression that filling is the line bottleneck. In reality, modern volumetric piston fillers and weight-controlled fillers run substantially faster than batch retort cycles, so fillers almost always accumulate cans in queue waiting for the seamer or retort rather than stalling the line.
True filling bottlenecks occur in three specific scenarios:
- Viscosity change forcing slower pump speed: A product recipe change from water-pack to oil-pack or from chunk to gravy formulation may require filler speed reduction of 20 to 40 percent to maintain fill weight accuracy. Schedule viscosity-sensitive SKUs in longer continuous batches to minimize changeover frequency.
- Sanitary changeover between allergen or species groups: Cleaning cycles between tuna and sardine runs, or between pet food and human food runs, can consume 45 to 90 minutes per changeover. This is a scheduling bottleneck, not a cycle time bottleneck, and responds to campaign planning rather than equipment upgrade.
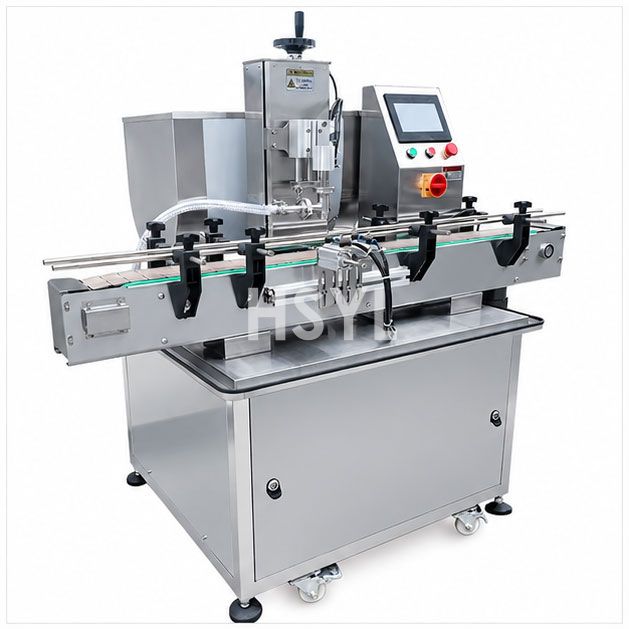
- Particulate size approaching nozzle diameter: Chunk tuna, whole baby corn, or large bean varieties may bridge at the filler nozzle, requiring slower fill speed or larger nozzle specification. The fish can filling machine selection should match particulate size to nozzle geometry at the specification stage, not after installation.
If the filler frequently stops but downstream queue length stays stable, the cause is almost always upstream conveyor timing or downstream seamer infeed synchronization, not the filler itself. Retooling filler nozzles without addressing conveyor timing rarely improves sustained line output.
3. Seaming Station: Quality Gate, Not Usually the Pacemaker
Seaming creates the double-fold hermetic seal that locks the can, and a bad seam causes leakers that fail retort pressure tests or shelf-life validation. Quality teams therefore watch seaming closely, generating extensive teardown data and frequent adjustment interventions. This scrutiny creates the impression that seaming limits line speed. In most canning lines, however, the seamer runs faster than the retort, making it a quality gate rather than a throughput gate.
When seaming actually becomes the line bottleneck, three conditions are usually present:
| Condition | Symptom | Root Cause | Fix |
|---|---|---|---|
| Running new can diameters without validated tooling changeover | Frequent teardown failures on first shift after diameter change | Seamer rolls and chuck not matched to new can specification; first-operation and second-operation roll pressures set by guess rather than validated procedure | Develop written changeover procedure with torque values, roll gap measurements, and post-changeover teardown protocol. Validate three cans from each spindle before resuming production. |
| Running above seamer rated CPM without can guidance upgrade | Cans tipping or jamming at infeed starwheel, seamer stops to clear jams | Infeed conveyor speed exceeds can stability threshold at the transfer point; can body geometry cannot maintain orientation under higher centripetal force | Reduce line speed to seamer rated CPM, or install can guidance rails and transfer starwheel upgrade kit specified for higher speed operation. |
| Vacuum level too high causing can collapse before seaming completes | Visible can body deformation at seamer discharge, seam teardown shows short body hook | Vacuum chamber evacuation pulls can body inward before lid is seated; common with thin-wall aluminum cans or large-diameter steel cans at deep vacuum settings | Reduce vacuum to manufacturer-specified range for the can specification, or switch to mechanical exhaust (steam flow closure) for the affected SKU. Deep vacuum settings of 25 to 29 inHg are not universally appropriate. |
If seaming stops the line, the first inspection should be the can supply from the depalletizer or the retort infeed chute — both can create mechanical jams that look like seamer faults. The vacuum can seamer for canned fish is engineered for sustained throughput well above typical batch retort capacity, so seamer-side throughput problems usually trace to integration issues rather than the seamer itself.
4. Retort: The Usual Throughput Pacemaker
Retort is the thermal processing station where sealed cans receive their commercial sterilization cook. Batch retort cycles last 45 to 90 minutes depending on product type, can size, retort technology, and the F0 lethality value specified by the process authority. No amount of speed at filling or seaming can overcome a 65-minute retort hold — cans simply queue at the retort infeed until the next basket becomes available.
Retort becomes the line bottleneck in three common situations:
- Batch size smaller than filler output between cycles: If the filler produces 1,200 cans during a 60-minute retort cycle but the retort basket holds only 800 cans, 400 cans accumulate in queue every cycle. After 8 hours, the queue exceeds 3,000 cans and forces filler stoppage. The fix is larger baskets, additional retort vessels, or staggered multi-vessel scheduling.
- Multiple recipes sharing one retort: Different F0 targets, different come-up times, and different cooling parameters prevent combining products in a single batch. Recipe changeover consumes 15 to 30 minutes of retort idle time plus steam purge. Schedule similar-process products in campaigns to maximize vessel utilization.
- Cooling water temperature forcing longer cycle: When cooling water inlet temperature exceeds 25 degrees Celsius, cooling phase duration extends substantially to reach safe stacking temperature. In tropical climates or summer operations, cooling water temperature can add 10 to 20 minutes to every retort cycle, silently reducing daily throughput by 15 to 25 percent.
How to Confirm Retort Is Your Bottleneck
- Calculate retort effective throughput: Cans per basket × baskets per vessel ÷ total cycle time. For a retort holding 1,200 cans with a 65-minute cycle, effective throughput is approximately 1,108 cans per hour.
- Compare to filler output: If filler output exceeds retort throughput by more than 15 percent, retort is the constraint. The 15 percent threshold accounts for normal buffer absorption and minor speed variations.
- Measure queue length before retort infeed: A growing queue across consecutive cycles confirms upstream stations are running faster than retort can absorb. A stable or shrinking queue suggests retort is keeping pace.
- Check retort utilization against available shift time: If retort operates more than 85 percent of available shift time (including loading, unloading, and cleaning between batches), it is the pacemaker. Below 70 percent utilization, look elsewhere for the constraint.
Retort Bottleneck Fixes Without Buying a New Vessel
- Add a second retort basket and stagger cycles: Two vessels with staggered start times can approach continuous-like throughput from batch equipment. Four vessels with 65-minute cycles staggered at 16-minute intervals produce one completed batch every 16 minutes on average.
- Optimize come-up and cooling times: Better steam control, improved venting sequences, and recirculating chiller integration can reduce total cycle time by 8 to 15 percent without changing the validated F0 target. Any change to come-up or cooling parameters requires process authority review before implementation.
- Group products by similar process parameters: Combine SKUs sharing the same F0 target, retort temperature, and can size range into single production campaigns to minimize empty basket swaps and recipe changeover idle time.
- Improve basket loading density: Staggered honeycomb packing achieves approximately 15 percent more cans per layer than aligned square grid packing for round cans, with zero additional equipment investment.
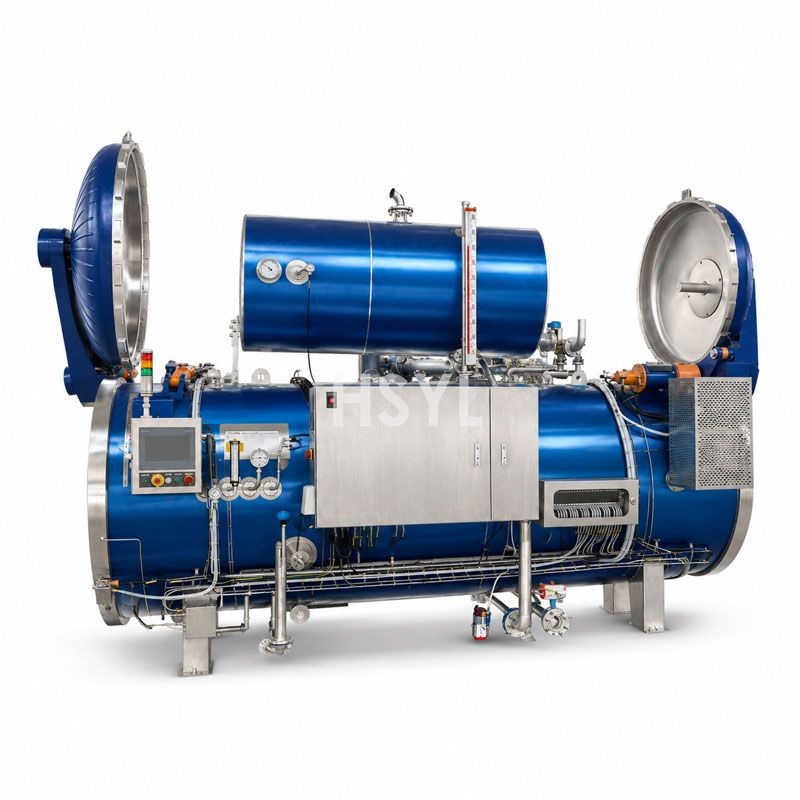
For a comprehensive treatment of retort vessel selection, basket loading patterns, F0 calculation, and multi-vessel staggered operation, see the companion guide on retort sterilizer batch, basket and process design factors. The retort sterilizer for canned fish product page covers specific equipment configurations for fish canning applications.
5. Cooling: The Hidden Capacity Drain
Cooling receives less attention than retort because it produces fewer alarms and operates continuously rather than in discrete batches. But cooling can be an equal or greater bottleneck than retort, particularly in warm-climate operations or facilities with undersized cooling water infrastructure. After retort, cans must cool from processing temperature (typically 118 to 124 degrees Celsius) to safe stacking temperature (typically 38 to 40 degrees Celsius) before they can be labeled, cased, and palletized.
Cooling capacity depends on three variables that managers frequently fail to monitor:
| Variable | Target Range | Impact When Out of Range | Diagnostic Check |
|---|---|---|---|
| Cooling water inlet temperature | Below 20 degrees Celsius for spray cooling; below 18 degrees Celsius for immersion cooling | Every 5 degrees Celsius above target extends cooling time by 15 to 25 percent. Water above 25 degrees Celsius may make target can temperature unreachable regardless of dwell time. | Log chiller water temperature at hourly intervals across full shift. Identify peak temperature periods and correlate with line output drops. |
| Spray pressure or immersion flow rate | 2 to 4 bar spray pressure; 15 to 50 cubic meters per hour immersion flow depending on vessel size | Low pressure or flow produces uneven cooling across basket positions, forcing extended dwell time to ensure coldest can reaches target temperature. | Measure pressure at spray manifold inlet. Inspect nozzles for scale buildup or partial blockage. Compare flow meter readings to equipment specification. |
| Can spacing in cooling tunnel | Minimum 5 millimeter gap between adjacent cans on cooling conveyor; single-layer spacing preferred for large cans | Tight spacing creates thermal shadowing where center cans in a cluster cool slower than perimeter cans. Cooling time must extend to accommodate slowest can. | Measure can center temperature at multiple positions across conveyor width using handheld infrared thermometer or temperature data logger. |
Hidden Cost of Inadequate Cooling: When cooling capacity lags retort output, operators face pressure to open retort doors early or stack wet cans. Both practices create quality and safety risks — early door opening may deliver insufficient F0 lethality in the slowest-heating can, while stacking wet cans promotes post-process contamination through seam micro-leakage as the can cools and draws vacuum. Neither practice is acceptable under validated thermal process protocols, but both occur in practice when cooling capacity is undersized. The correct response is to add cooling capacity, not to compromise process safety.
Cooling Bottleneck Fixes
- Monitor can center temperature, not surface temperature: Surface temperature reaches target long before center temperature. Validate cooling adequacy by instrumenting sample cans with center-point thermocouples and recording the actual cooling curve.
- Increase water flow rate or add recirculating chillers: If ambient water temperature is the limit, a recirculating chiller system sized for peak cooling demand can reduce inlet water temperature by 8 to 15 degrees Celsius, cutting cooling time by 30 to 50 percent.
- Stagger retort discharge timing: Schedule retort vessel discharge across the shift to smooth cooling load peaks rather than discharging multiple vessels simultaneously and overwhelming the cooling tunnel.
- Add a second cooling stage: A two-stage cooling system with a high-temperature initial spray followed by a low-temperature final immersion can achieve target can temperature in 30 to 40 percent less total dwell time than a single-stage system at the same water temperature.
6. Four-Station Comparison at a Glance
The accumulated differences across the four stations produce a clear pattern of where bottlenecks typically reside on batch-retort canning lines:
| Station | Typical Cycle Time Per Unit | Common Failure Mode | Defect or Capacity Issue | Bottleneck Probability |
|---|---|---|---|---|
| Filling | Seconds per can | Underfill, overfill, viscosity drift | Defect — visible immediately at check-weigher | Low — usually runs faster than retort |
| Seaming | Seconds per can | Leaker seam, tooling wear, vacuum drift | Defect — visible at teardown or retort leak test | Low — usually runs faster than retort |
| Retort | 45 to 90 minutes per batch | Batch limit, process authority hold, F0 deviation | Capacity — measured at end-of-shift throughput | High — usual pacemaker on batch lines |
| Cooling | 15 to 40 minutes per batch | Water temperature, tunnel capacity, can spacing | Capacity — measured at stacking temperature arrival | Medium-High — equal to retort in warm climates |
7. One-Shift Diagnostic Protocol
Identifying the real bottleneck on a canning line requires one focused shift of measurement, not weeks of data collection. The following protocol produces a defensible diagnosis in 8 to 10 hours of observation:
- Map takt time for each station using a stopwatch and a count of 100 cans: Stand at each station in sequence, time how long it takes to process 100 cans (or complete one batch for retort), and divide by 100 to get per-unit cycle time. Repeat for filling, seaming, retort, and cooling.
- Calculate utilization percentage for each station: Divide actual cycle time by takt time, multiply by 100. The station with the highest utilization above 85 percent is the bottleneck candidate. Stations below 70 percent are running with spare capacity.
- Identify where queues accumulate: Walk the line every 30 minutes and photograph accumulation points. Cans piling up before a station indicate that station is the pacemaker. Cans absent before a station indicate that station is starved by an upstream constraint.
- Check downtime logs for the previous 10 production days: Total accumulated stop time by station. The station with the longest accumulated stop time is not necessarily the bottleneck — stations that stop frequently may stop because they are blocked by a downstream constraint or starved by an upstream constraint. Cross-reference with queue observations.
- Validate with a controlled test: Speed up the suspected bottleneck station by 10 percent using overtime staffing, an additional operator, or a temporary parameter adjustment within validated limits. If total line output rises by approximately 10 percent, you have confirmed the constraint. If output rises by less than 5 percent, the suspected bottleneck is not the real constraint — repeat the test on the next candidate station.
- Document findings and schedule the fix: Record the diagnosis, the supporting measurements, and the recommended capacity intervention in a one-page summary for management review. Constraint identification without scheduled correction produces no throughput improvement.
8. Where to Invest First: The Cost-Value Calculation
Once the bottleneck is identified, the question becomes whether to invest capital in expanding that station or to extract more capacity from existing equipment through operational changes. The cost-value logic differs by station:
| Bottleneck Station | Operational Fix (Low Capital) | Capital Fix (Higher Capital) | Typical Payback Logic |
|---|---|---|---|
| Filling | Longer continuous batches, viscosity management, conveyor timing adjustment | Additional filler head, second parallel filler, automated changeover system | Operational fixes almost always preferred. Capital addition only justified when viscosity range genuinely exceeds current equipment capability. |
| Seaming | Validated changeover procedures, tooling inventory, infeed conveyor synchronization | Higher-CPM seamer, second parallel seamer, automatic can guidance upgrade | Operational fixes first. Capital addition only when sustained throughput exceeds current seamer rated CPM by more than 20 percent. |
| Retort | Staggered multi-vessel scheduling, basket loading density optimization, come-up time reduction within validated limits, recipe campaign grouping | Second retort vessel, larger vessel, continuous retort conversion | Operational fixes recover 10 to 25 percent capacity at near-zero cost. Second vessel justified when operational fixes exhausted and demand growth is confirmed. |
| Cooling | Water temperature monitoring, spray nozzle cleaning, can spacing adjustment, retort discharge staggering | Recirculating chiller system, additional cooling tunnel, two-stage cooling conversion | Operational fixes recover 5 to 15 percent capacity. Chiller addition typically pays back in 12 to 24 months when current water temperature exceeds 25 degrees Celsius. |
Investment Sequence Rule: Always extract maximum capacity from operational fixes before committing capital. Operational fixes are reversible, low-risk, and produce immediate measurable results. Capital additions are irreversible, require validation, and produce benefits only after installation and commissioning delays. The correct sequence is operational fixes first, measurement second, capital investment third — never the reverse. A common error is purchasing a faster filler when the real constraint is retort cycle time; the faster filler simply accumulates larger queues without improving line output.
9. Continuous Constraint Management
Bottlenecks are not static. As line conditions change — recipe rotation, raw material variation, equipment wear, operator skill evolution, seasonal temperature shifts — the constraint station may move. A retort bottleneck resolved by adding a second vessel may shift the constraint to cooling or to seaming. Monthly bottleneck review prevents the line from operating below capacity because no one noticed the constraint had moved.
The monthly review should repeat the one-shift diagnostic protocol in condensed form: 2 hours of queue observation, utilisation recalculation from recent downtime logs, and confirmation that the previously identified bottleneck remains the pacemaker. If the constraint has moved, schedule the next round of operational or capital intervention against the new pacemaker, not the old one.
This discipline applies regardless of line scale. Small artisanal canneries producing 2,000 cans per day and industrial plants producing 60,000 cans per day both benefit from explicit bottleneck identification. The diagnostic methodology is identical; only the capital response differs based on volume and growth trajectory.
Related Canning Line Planning and Equipment Resources
The following resources address equipment selection, retort process design, and production line planning that connect directly to bottleneck diagnosis and capacity expansion decisions:
- Retort Sterilizer for Canned Food: Batch, Basket and Process Design Factors — Comprehensive treatment of retort vessel architecture, heating medium selection, basket loading patterns, F0 process development, and multi-vessel staggered operation. The natural complement to this diagnostic guide, covering the design decisions that determine whether retort becomes a bottleneck in the first place.
- Retort Sterilizer for Canned Fish — Equipment specification page covering retort vessel configurations engineered for canned fish thermal processing applications, with capacity ranges relevant to bottleneck calculations.
- Vacuum Can Seamer for Canned Fish — Seamer equipment specification relevant to confirming whether seamer cycle time can sustain throughput above retort capacity, or whether seamer upgrade is required before retort bottleneck can be addressed.
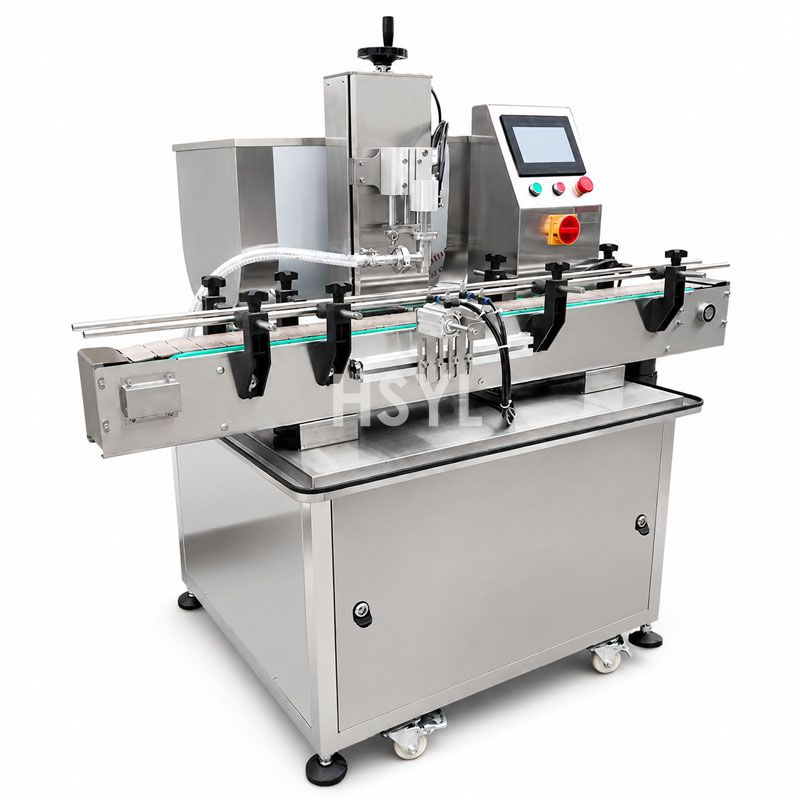
- Fish Can Filling Machine — Filler equipment specification covering volumetric and weight-controlled filling configurations, with throughput ranges that determine whether filling can serve as a buffer station or may itself become a constraint under specific product formulations.
Frequently Asked Questions
What is the most common bottleneck on a canned food production line?
How do I diagnose which canning line station is the bottleneck?
Can a faster filler increase overall canning line throughput?
Why does retort become the bottleneck on batch canning lines?
How does cooling water temperature affect canning line capacity?
What is takt time versus cycle time in canning line analysis?
Should I upgrade filling or retort first to increase canning output?
How can I increase retort throughput without buying a new vessel?
When should I add a buffer conveyor between canning line stations?
Related Articles




Get professional consultation
Do you have any questions or need technical support regarding the content of this article? Fill out the form below, and our expert team will provide you with professional solutions.